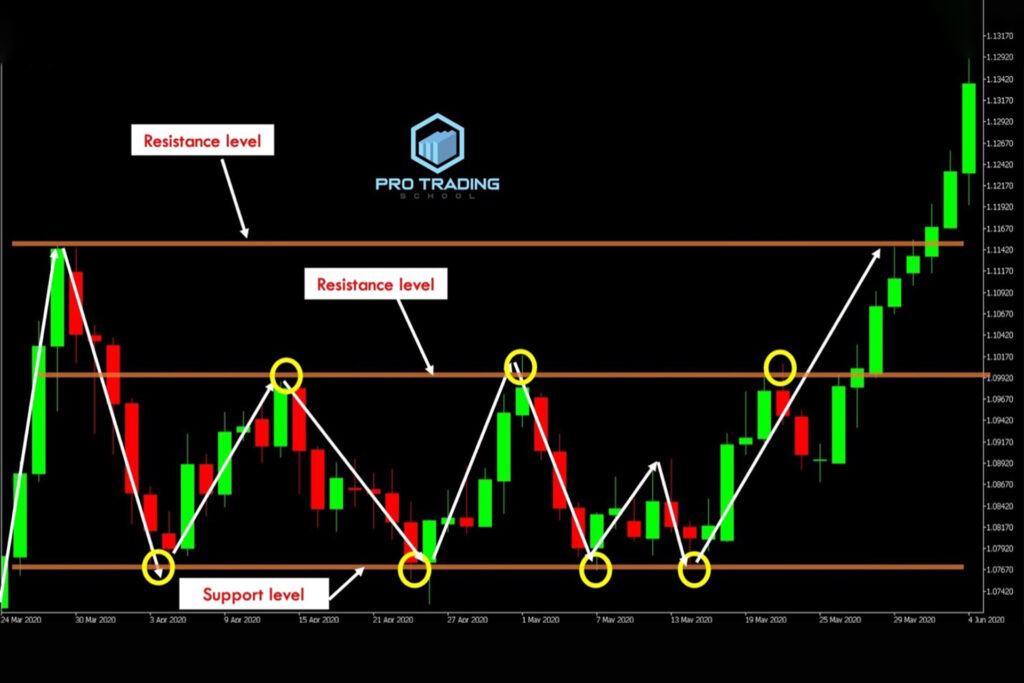
Support and Resistance Levels: Identifying Key Price Points
In the world of stock trading, understanding price movements is crucial. Two key concepts that traders often rely on are support and resistance levels. These levels help traders identify potential entry and exit points, making them essential tools for technical analysis. In this blog, we’ll break down what support and resistance levels are, how to identify them, and why they are important for making informed trading decisions. If you’re interested in stock market classes in Delhi, this knowledge will be invaluable.
What Are Support and Resistance Levels?

.
What Are Support and Resistance Levels?
Support Level: This is a price level where a stock tends to find buying interest, causing it to “bounce” back up. Think of it as the floor that prevents the stock from falling further. When the price hits this level, it often indicates that buyers are willing to purchase the stock, creating upward pressure. For those taking trading classes in Delhi, understanding support levels is fundamental.
Resistance Level: Conversely, a resistance level is a price point where selling interest is strong enough to prevent the stock from rising further. It acts as a ceiling, stopping the price from going higher. At this level, sellers outnumber buyers, leading to downward pressure on the price. Online stock market classes in Delhi often emphasize the importance of identifying resistance levels.
Why Are Support and Resistance Important?
Predicting Price Movements: Identifying these levels helps traders anticipate where the price might change direction. This can aid in making buy or sell decisions.
Setting Stop-Loss Orders: Traders use support and resistance levels to set stop-loss orders, which can limit potential losses.
Planning Trades: These levels help in planning entry and exit points, ensuring more disciplined trading.
How to Identify Support and Resistance Levels
1.Historical Price Data
One of the easiest methods to identify support and resistance levels is by examining historical price data. By examining past price movements, you can spot levels where the price consistently stopped falling (support) or rising (resistance). This technique is often covered in stock market classes in Delhi.
Example: If a stock consistently finds support around ₹150 and resistance around ₹200, these levels become key reference points for future trades.
2.Trendline
Trendlines are drawn on a chart to connect a series of price points. An upward trendline (support) connects the low points of the stock price, indicating an area where buying interest is strong. A downward trendline (resistance) connects the high points, showing where selling interest prevails. Learning to draw trendlines is a key skill taught in trading classes in Delhi.
How to Draw:
Support Trendline: Connect at least two or more low points.
Resistance Trendline: Connect two or more high points.
3.Moving Averages
Moving averages can serve as dynamic support and resistance levels.A moving average smooths out price data to identify the direction of the trend over a specific period. Online stock market classes in Delhi often highlight the use of moving averages in technical analysis.
Common Types:
Simple Moving Average (SMA): Average price over a specific period.
Exponential Moving Average (EMA): Gives more weight to recent prices.
When the stock price is above the moving average, it can act as support. When below, it can act as resistance.
4.Psychological Levels
Traders often react to round numbers (like ₹100, ₹500, ₹1000) because these levels are perceived as significant. These psychological levels can act as support or resistance due to the collective behavior of market participants. Stock market classes in Delhi will often cover the psychological aspects of trading.
Using Support and Resistance in Trading
1.Trading the Bounce
When a stock price approaches a support level, traders might look to buy, anticipating that the price will “bounce” off this level. Similarly, when the price approaches a resistance level, traders might sell or short, expecting the price to fall back.
Example: If Stock XYZ has support at ₹150, a trader might place a buy order near this level, expecting the price to rise.
2.Trading the Breakout
Sometimes, the price breaks through support or resistance levels, leading to significant price movements. Traders look for breakouts to capture these moves. Trading classes in Delhi often focus on strategies to trade breakouts effectively.
Example: If Stock XYZ breaks above the resistance level of ₹200, traders might enter a long position, expecting further upward momentum.
Tips for Effective Use
Combine with Other Indicators: Use support and resistance levels in conjunction with other technical indicators like RSI (Relative Strength Index) or MACD (Moving Average Convergence Divergence) for better accuracy.
Be Flexible: Support and resistance are not exact numbers but zones. Be prepared for slight price deviations.
Volume Confirmation: Higher trading volumes near support or resistance levels can provide confirmation of these levels’ strength.
Conclusion
Support and resistance levels are fundamental concepts in technical analysis that can greatly enhance your trading strategy. By understanding and identifying these key price points, you can make more informed decisions, manage risk better, and improve your overall trading performance. Whether you are a novice or an experienced trader, mastering support and resistance levels is crucial for navigating the stock market successfully. Happy trading!
If you’re looking to deepen your knowledge, consider enrolling in stock market classes in Delhi or trading classes in Delhi. For more flexibility, there are also online stock market classes in Delhi that can help you master these concepts from the comfort of your home.
